Did you know that your fertility chart can tell you more than when you will ovulate?
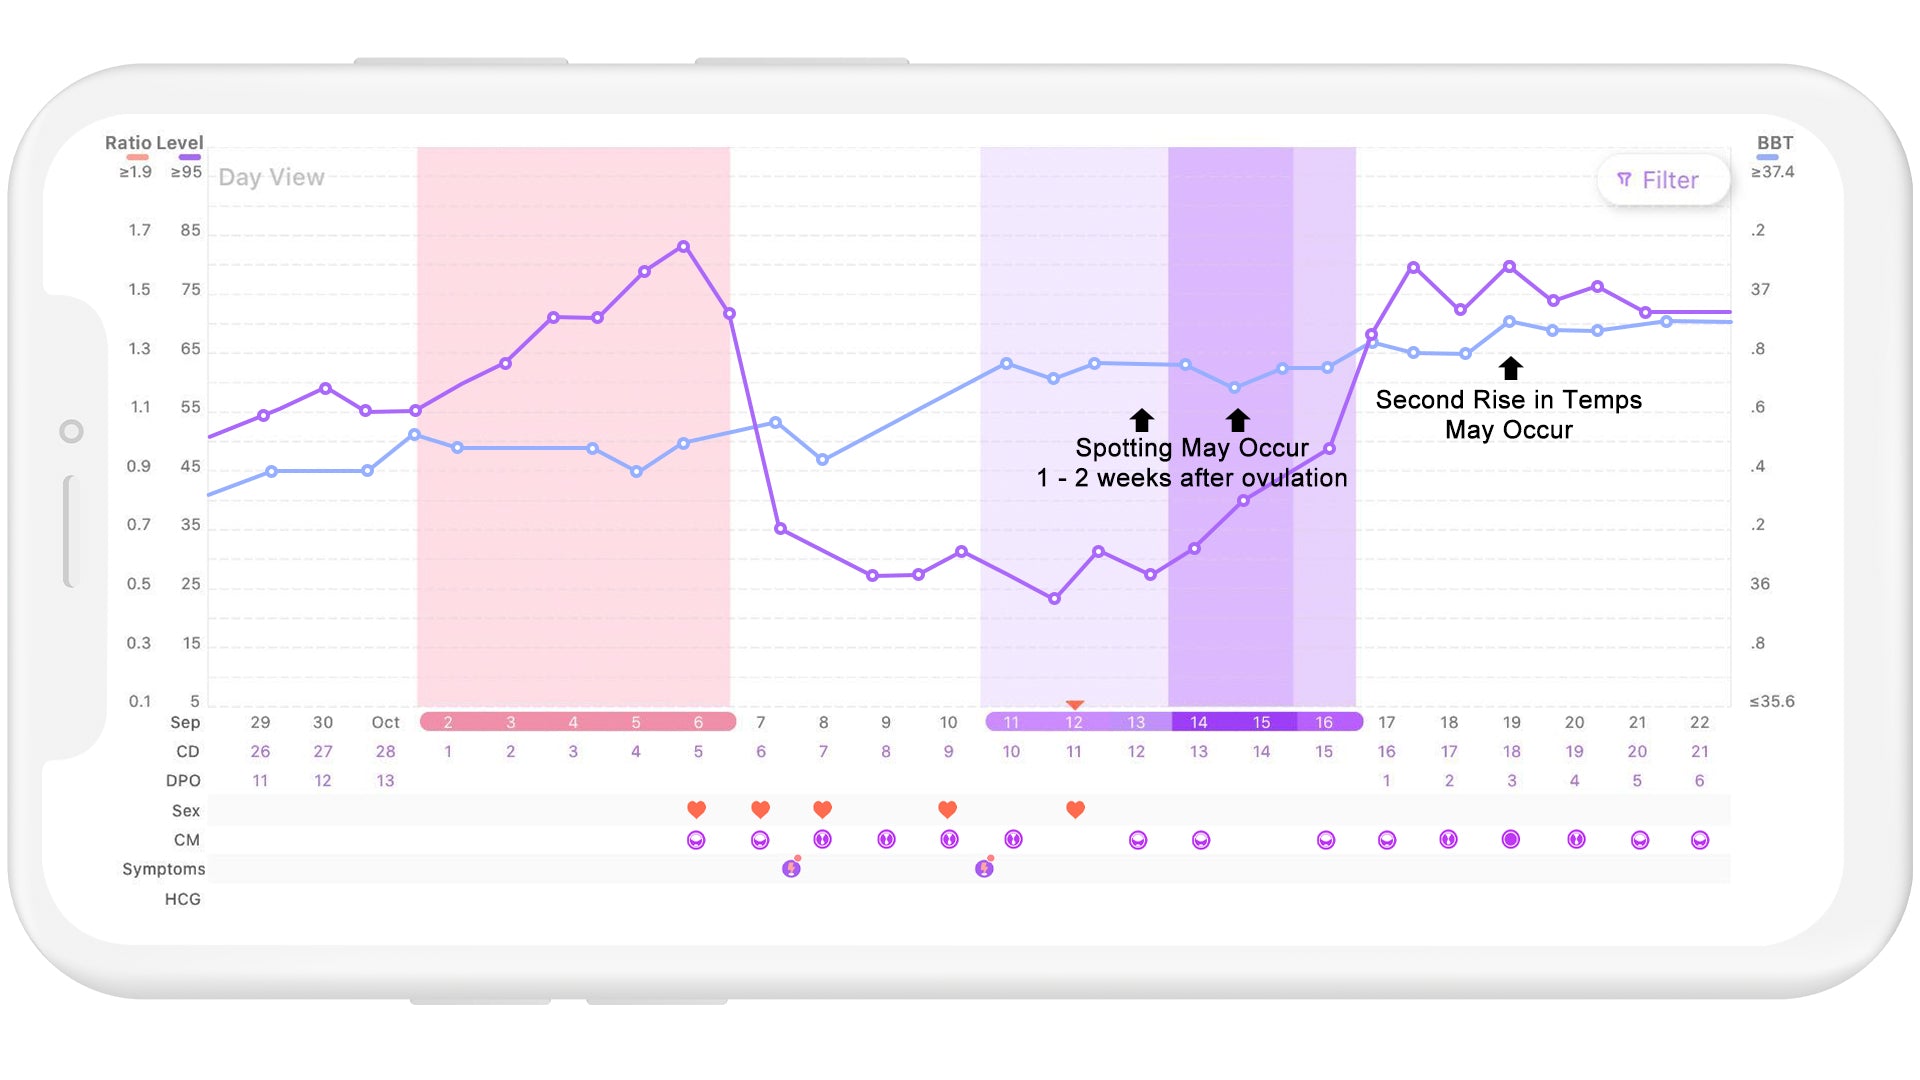
Your chart can provide clues about your fertility health and potential pregnancy! Below are sample charts to help you learn more about what to expect in a healthy fertility chart.

A Common Ovulation Chart
The above chart illustrates a normal menstrual cycle which may vary between 24-36 days in length. Cycles are divided into two phases: preovulatory and postovulatory with ovulation in between the two phases.
Preovulatory Phase:
Begins: first day of red menstrual bleeding which is considered cycle day 1
Ends: at ovulation
Length: average 14 days in length, but may vary due to stress, illness or medical conditions which may delay ovulation
Basal Temperatures: Range from 97.0-97.8 degrees Fahrenheit
Main Hormone: Estrogen is released from the ovary, which matures an egg to be released at ovulation
Ovulation
Typically occurs on cycle day 12-16
Main Hormone: Luteinizing Hormone (LH) is released from the brain and causes ovulation. The LH peak indicates ovulation will likely occur within the next 24-36 hours.
Postovulatory Phase:
Begins: after ovulation.
Ends: a day before the first day of the next menstrual bleeding
Length: 12-16 days and is consistent between cycles
Basal Temperatures: typically rise 1-2 days after ovulation
Main Hormone: Progesterone is released from the corpus luteum within the ovary after ovulation and causes basal temperatures to rise
How Can I Tell If I Am Pregnant from My Chart?


After ovulation, if an egg is fertilized it will move through the fallopian tube to the uterus and implant within the uterine wall. Implantation typically occurs around 1-2 weeks after ovulation. Once implantation occurs, the hormone progesterone rises, as well as the pregnancy hormone hCG.
There are four potential signs of pregnancy you may notice from your fertility chart:
1) Temperatures remain elevated longer than your typical luteal phase. The luteal phase is the time after ovulation until the next menstrual cycle and is usually 12-16 days in length. If your temperatures remain high for 18 or more days it may be an indicator of pregnancy.
2) You may notice two levels of high temperatures after ovulation. At the time of implantation progesterone levels rise again, which may cause a second elevation in temperatures.
3) Brown spotting may occur at the time of implantation as the baby burrows into the uterine wall. Spotting can occur anytime from 1-2 weeks after ovulation while temperatures remain elevated.
4) You may have a second peak or positive LH test strip occurring 1-2 weeks after ovulation. The pregnancy hormone, hCG is similar in structure to LH. Once hCG levels begin to rise, an LH strip may read positive.
How Do I Know If I’m Not Ovulating?

Anovulation is a term used when a woman does not ovulate during a menstrual cycle. It is normal for a woman to experience an occasional cycle in which she does not ovulate, due to illness or stress; however, a pattern of non-ovulatory cycles are a concern. Charting fertility can offer signs on whether or not a woman is ovulating.
Potential signs of anovulation from charting:
1) Sporadic basal temperature patterns with no distinguishable rise in temperatures the second half of the cycle.
2) Negative qualitative LH strips or a T/C ratio consistently less than 1.0.
3) No noticeable fertile-type cervical mucus.
Want to know more? See your healthcare provider if you are noticing patterns of concern. For general chart questions, our customer service is ready to assist! Message them directly through “Support” in the app.
Coming Soon: medical professional consultations through your Premom app!


